
- Problem definition
In blog W7, I discussed one of the tools that are used to manage projects activities and to make it easier to identify the tasks problems and what are the consequences of delaying projects and control that. We discussed how to develop Gantt chart and what are the elements to be identified in order to come up with a proper Project schedule from the first activities to the very last. In this blog, am going to explain how to draw a critical path using the activities starting time, duration and the relationships between each activity.
- Identify the Possible Alternative
Critical Path Analysis (CPA) and PERT are powerful tools that help you to schedule and manage complex projects. As with Gantt Chart , Critical Path Analysis (CPA) or the Critical Path Method (CPM) helps you to plan all tasks that must be completed as part of a project. They act as the basis both for preparation of a schedule, and of resource planning. During management of a project, they allow you to monitor achievement of project goals. They help you to see where remedial action needs to be taken to get a project back on course [1].

Fig.1 CPM approach [2]
- Development of the Outcome for Alternative
As with Gantt Charts, the essential concept behind Critical Path Analysis is that you cannot start some activities until others are finished. These activities need to be completed in a sequence, with each stage being more-or-less completed before the next stage can begin. These are ‘sequential’ activities. Other activities are not dependent on completion of any other tasks. You can do these at any time before or after aparticular stage is reached. These are non-dependent or ‘parallel’ tasks.
- Selection of Criteria
The following steps will show how to draw a critical path:
- List all activities in the plan
From the previews blog, I listed all the activities in the example project as follows:
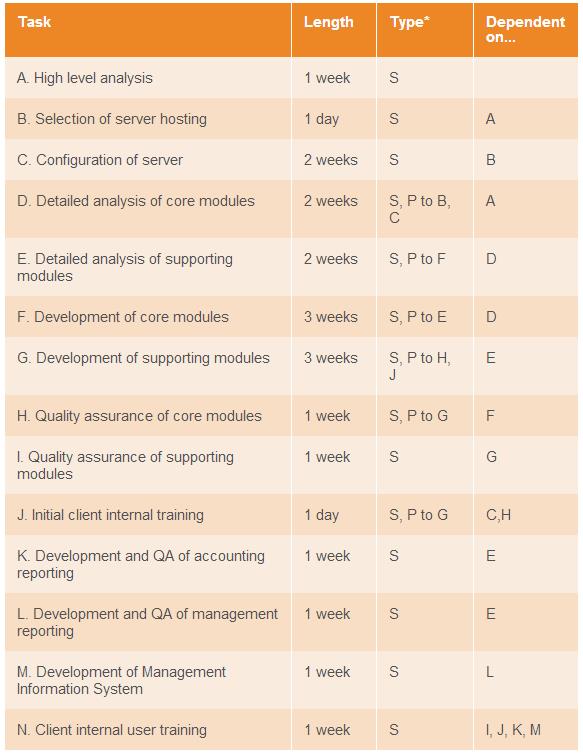
Table.1 Listing all the tasks for the project
- Plot the activities as a circle and arrow diagram
In these, circles show events within the project, such as the start and finish of tasks. The number shown in the left hand half of the circle allows you to identify each one easily. Circles are sometimes known as nodes. The length of the task is shown above it. By convention, all arrows run left to right. Arrows are also sometimes called arcs.
An example of a very simple diagram is shown below:

Fig.2 simple circles and arrow
Fig.2 shows the activity number, starting time and the duration of the activity. Circle 1 and circle 2 showing the start and the ends of the high level analysis activity, while the arrow in between shows the carrying out of the activity itself.
Where one activity cannot start until another has been completed, we start the arrow for the dependent activity at the completion event circle of the previous activity. An example of this is shown below:

Fig.3 Circle and arrow shows two activities that cannot start unless the first activity ends.
Here the activities of ‘Select Hardware’ and ‘Core Module Analysis’ cannot be started until ‘High Level Analysis’ has been completed.
- Analysis and Comparison of the Alternative.
The critical path diagrams used the information was listed in the previews blog in the Gantt chart and the relationships that identified earlier in order to make easy to study the impacts of delays in a certain activity. The drawn diagrams in Fig.2 and Fig.3 bring out a number of other important points:
- An arrow running between two event circles shows the activity needed to complete that task.
- A description of the task is written underneath the arrow.
- Within Critical Path Analysis, we refer to activities by the numbers in the circles at each end. For example, the task ‘Core Module Analysis’ would be called activity 2 to 3. ‘Select Hardware’ would be activity 2 to 9.
- Activities are not drawn to scale. In the diagram above, activities are 1 week long, 2 weeks long and 1 day long. Arrows in this case are all the same length.
- In the example above, you can see a second number in the top, right hand quadrant of each circle. This shows the earliest start time for the following activity. It is conventional to start at 0. Here units are whole weeks.
- Performance Monitoring and the Post Evaluation of Result.
Critical Path Method give the management an overall view about the project flow. This will give the project management time to identify the worst case and the probability of the project delays and how to manage any scenario. It will also give the project an idea in how to utilize the resources and how to use the excess resources in an activity that is ahead of time and utilize it in an activity that falling behind. CPM will also give a great idea in how to prioritize the activities in order to know what are the activities that will cause the project to delay (mainly activities that in critical path).
To conclude, CPM is a great tool in planning and scheduling any project and will a great look ahead for the project.
References
- Change management. (2014, July 22). Retrieved August 20, 2014. http://en.wikipedia.org/wiki/Change_management
- Santiago, J., & Magallon, D. (2009, February 4). CRITICAL PATH METHOD. Retrieved August 20, 2014. http://web.stanford.edu/class/cee320/CEE320B/CPM.pdf
- Critical Path Analysis and PERT Charts: Planning and Scheduling More Complex Projects. (n.d.). Retrieved August 20, 2014. http://www.mindtools.com/critpath.html

Sorry Said, but I am going to REJECT this blog posting……. Why? The last time I used the ADM method was back in 1979…… PMI did away with it on the PMP exam back around the PMBOK Guide 3rd Edition.
Now, WHY did PDM replace ADM?
What is it that PDM can do that you CANNOT do in ADM? What I suggest you do for your W8.1 blog posting is set up an AFFINITY DIAGRAM showing us WHY the PDM method has replaced the ADM method….. (And be sure to ask me about this when we meet up face to face as there is an interesting story behind it)
BR,
Dr. PDG, Jakarta, Indonesia