Stable Currency for Trading.
Problem Recognition and Definition
Currency is commonly known as an accepted form of money, including coins and paper notes that is used as a medium of exchange for goods and services [1]. It is the basis of trade and hence the basis of the economy’s health and stability. The official currency of Oman is the Omani Rial. One Rial is equivalent to 2.59067 US Dollars. In 1986, the national currency of Oman was pegged to the US dollar. Taking into consideration that Oman is one of the countries producing crude oil, it was a practical step to peg the national currency to the US Dollars. As it was evaluated at the time, for an open economy such as the Omani’s, the fixed peg to the US dollar provided a source of stability that allowed promoting trade and investment. Therefore, all investments in Oman are carried out with the US Dollar currency. However, as noted in the recent years, the US Dollar has shown increasing volatility in the current currency market index. Global reports indicate its instability is due to various factors such as inflation, political and economic fluctuations. This formed the requirement to investigate an alternative stable currency for trading and investment for a stable Omani economy. Hence, the topic of this study case.
Development of feasible alternatives
To find a suitable alternative basis of trade for the Omani economy, the currency should be as defined a form of money that is accepted globally. It also required to be consistent. In order To determine a predictable system, 3 various index were analyzed using historical data as illustrated in the following table:
| Inflation rate | US Dollar Index | Gold Price | |
| Definition | It is known as the percentage change in the value of the Wholesale Price Index (WPI) on an annual basis. It effectively measures The rate at which the general level of prices for goods and services is rising in a year and, subsequently, purchasing power is falling. | This index measures the performance of the US Dollar against a basket of currencies | Gold is considered a safe-haven asset as throughout history it has been viewed as a store of value” Investing in gold is a great method to diversify investment portfolios, evade against a financial crisis, and even protect against inflation |
| Why? | For this case study, US inflation rate will be measured due to its direct linkage to the Omani Rial Currency. | Although it has been quantified that there are atleast 5 other currencies competing with the US dollar, selecting the US index makes sense for this case due to:
|
Most countries central bank’s wealth is measured by the amount of Gold in their volts.It is price is not linked or pegged to any government or country’s economy. |
| Disadvantages |
|
|
|
| Could it be considered as a feasible alternative ? | Yes | Yes | Yes |
Data Analysis and Results
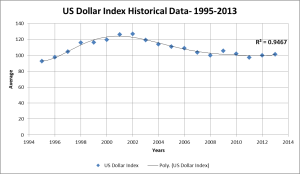
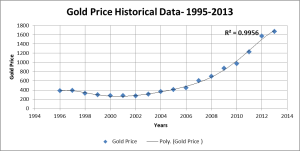
Regression analysis (which is a tool that includes the techniques for modeling and analyzing several variables, when the focus is on the relationship between a dependent variable and one or more independent variables) was used as tool to analyze the pattern of historical data and maps to best “fit” mathematical model. To ensure the accuracy of the analysis the Historical data is selected from 1995-2013 (18 years) was used for each analysis. The three charts below show the trending using MS Excel polynomial regression analysis.
Selection Criteria and Preferred Alternative
As per the results of the polynomial regression analysis, the criteria of the selection will predictability of the data. This could be determent by the coefficient Regression factor (R2) as illustrated in the following table
| Index/ selection criteria | US Inflation rate % | Us Dollar Index | Gold price measured in USD per tray ounce |
| R2 Value | 0.1549 | 0.9467 | 0.9956 |
The General rule for best prediction result is R2 value should be more than 0.95. Therefore, as shown in the above table the natural selection would be Gold Price measured in USD per tray ounce. However, the general notion of trading by gold price can be resisted in the current market. As mentioned earlier Currency Should be Accepted by all trading parties. Therefore, if Gold price is resisted, then the second option for trading currency can be US dollar index which as the regression analysis illustrated its R2 value is relatively close to the best fit of the polynomial regression model.
6. Monitoring and evaluation of the result
The concept of using Gold Price will be further explored for investments in Oman and more specific for Oil and Gas investments.
References:
- Investopedia (2014), Currency Definition. Retrieved on June 25, 2014 fromhttp://www.investopedia.com/terms/c/currency.asp
- Budi, Costeng (2014) W3_bud_Gold is the most suitable currency to use in cost estimate in early conceptdevelopment Retrieved on June 25, 2014 from http://topazsmartd.wordpress.com/2014/05/15/w3_bud_gold-is-the-most-suitable-currency-to-use-in-cost-estimate-in-early-concept-development/
- Reuters (September, 2007). Oman ‘firmly committed’ to dollar peg, Retrieved on June 25, 2014 from http://www.arabianbusiness.com/oman-firmly-committed–dollar-peg-rate-54688.html#.U6qmqJSSwpM
- Kumar, H (February, 2012). W2_Hari_US Dollars, Inflation and Gold Trends retrieved on June 25, 2014 from http://aacecasablanca.wordpress.com/2012/02/02/w2_hari_us-dollars-inflation-and-gold-trends/
- Anderson, K (June,2014) The Best Types of Gold to Buy Now, Retrieved on June 25, 2014 http://moneymorning.com/tag/gold-prices/
- Moffat, Mike (2014). Purchasing Power Parity: Link Between Exchange Rates and Inflation Retrieved on June 25, 2014 from http://economics.about.com/od/purchasingpowerparity/a/ppp.htm
- Trade Weighted U.S. Dollar Index: Broad (DTWEXB). Retrieved on June 25, 2014 from http://research.stlouisfed.org/fred2/series/DTWEXB/downloaddata
- KITCO Metals Inc. (2014). Gold Historical Data. Retrieved on June 25, 2014 from: http://www.kitco.com/scripts/hist_charts/yearly_graphs.plx.
- US Inflation (2014). US Inflation Rate. Retrieved on June 25, 2014 fromhttp://usinflation.org/us-inflation-rate/


AWESOME posting Mrs. Mahfoodha!!!
Exactly the kind of posting I am looking for, My only challenge to you would be in step 7. Essentially, to make this work, you need to continually update your projection based on the changing price of gold and you also need to calculate a RANGE estimate. (See Hari Kumar’s paper http://pmworldjournal.net/wp-content/uploads/2012/10/PMWJ4-Nov2012-SELLAPPAN-Gold-AlternativeCurrencyForProjectEstimation-Featured-Paper.pdf Figure 18 on page 17.
Keep up the excellent work and looking forward to seeing more blog postings of this quality in the coming weeks!!!
BR,
Dr. PDG, Jakarta