
1. Problem Definition
In the periodically meeting that held by the Board to determine the cause of the delays and the cost overrun of the projects in order to avoid such thing in the future projects and to be a historically record and learned lesson.
2. Identify the Feasible Alternative
The Board had met to determine the major problems which cause the delays and overspent and the following reasons were found:-
- Wrong cost estimate.
- Unrealistic schedule.
- Poor scope of work.
- Improper defined stockholders.
- Inaccurate reports
- Poor safety procedures and Plan.
- Poor quality method of statements and inspection test plans.
- Lack of supervision for the site.
- Lack of communication between the team.
3. Development of the Outcome for Alternative
To identify the most significant major cause for the Board to focus on, Pareto Chart would be generated to analyze the issues. Pareto chart is a bar and line graph where the bars represent the frequency sorted in descending order.
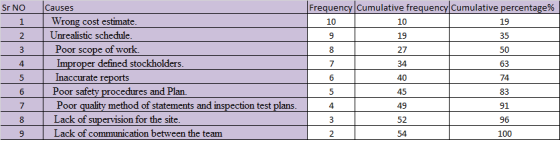
Table – 1Issues causing the Delay and Cost overrun
4. Selection Criteria
Pareto chart combines a column chart and a line graph. The Pareto principle states that, for many events, roughly 80% of the effects come from 20% of the causes. In this example, we will see that 80% of the Problems come from out of (20%) problems.
5. Analysis and Comparison of the Alternative

Figure-1 Pareto Chart Analysis
6. Selection of the Preferred Alternative
From the above figure it is very obvious that the board should pay additional care about the cost estimate and this gives clear indication that a lot of variation order was presented from contractor due to the inaccurate estimation for the cost of the project.
7. Performance Monitoring and the Post Evaluation of Result
The wrong cost estimation is the factor number one caused the delays and cost overrun but this factor is owing to other factors and these mainly are the poor scope work and the unrealistic Schedule.
Pareto chart is a good technique to understand the causes of the failures in managing the projects to avoid it in the future projects. In other words, it is a historical records for learned lesson.
8. Reference:
- Tague, N. R. (2005). The quality toolbox (2nd ed., pp. 376-378). Milwaukee, Wis: ASQ Quality Press.
- Sharma, S. (2013). Ten golden rules to avoid delays in ERP projects. Retrieved July 18, 2014, from http://www.computerweekly.com/opinion/Ten-golden-rules-to-avoid-delays-in-ERP-projects
- LAKSONO, A. (2014, June 17). W16_AL_Pareto Chart | Kristal AACE 2014. Retrieved July 18, 2014, from http://kristalaace2014.wordpress.com/2014/06/17/w16_al_pareto-chart/
- Bassard, Michael & Riter, Diane (2010). The Memory Jogger 2nd Edition, Canada, GOAL/QPC

Excellent case study, Ahmed!! And nice work on your analysis.
My challenge to you for your W12 blog posting would be to take it to the next step and do a ROOT CAUSE ANALYSIS to find out WHY the Cost Estimates are too low? The cost estimate being low is still a SYMPTOM and not a root cause.
Here are some references to help you get started:
http://asq.org/learn-about-quality/root-cause-analysis/overview/conducting-root-cause.html
http://www.mindtools.com/pages/article/newTMC_80.htm
Keep up the great work and looking forward to see where you take us with your RCA on why your cost estimates are too low…..
BR,
Dr. PDG, Jakarta